
Dashboarding Your Success
 This month at CCUMC, I will be discussing how Bates College began to turn around its service operations by using data, metrics, SLAs and dashboards. This is not an earth shattering new business tool, but it is something that I think many organizations still don’t use quite enough or don’t use it in the right way. At the conference, I will discuss how we did it and the results. Since this column will come out after that conference, I can also write about it here without spoiling the event.
Two years ago, we had a dedicated team of professionals working at the service desk, but no ability to ever judge if they were meeting the expectations of the college. As anyone who has ever worked in a support role in technology knows, you certainly do not always FEEL as though you are meeting the expectations. We often felt like we did not have enough staff, but how did we prove that? All you could do is show you did not get to a call on time or took too long to solve a problem, but wasn’t that just pointing out how you were not doing your work?
So I asked the team — both the help desk and our classroom technology team — to start keeping statistics on everything. Our classroom technology staff starting keep exact information on how many calls they recieved, how soon they responded to each call, how many calls came in after hours, etc. Our help desk kept stats on the typical service desk stats: number of calls, first call resolution, abandoned calls, number of calls going to voicemail, etc.
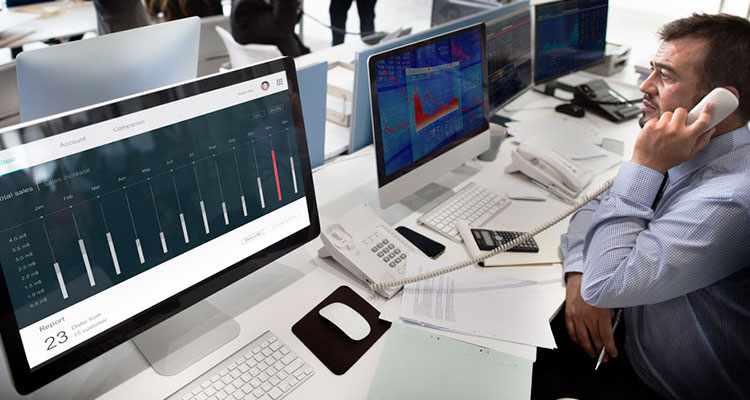
Next, we decided to start thinking about where we needed to improve. For our help desk, the first place was in voicemails being left. We did not like that people would ever call the desk and have to leave a voice message. After all, when someone calls, it’s because they have a problem that needs to be solved. We set a goal of the total number of calls during working hours that would go to voicemail. We set it up on our dashboard and talked about it every morning at our huddles and had it displayed on a dashboard in the office. Interestingly, not only could we see it, but everyone who came into the office could see it as well. To this end, our goal became not only our goal, but our customers as well.
We had several other goals that we set on certain things we wanted to improve. For classroom technology, we have always been very good at getting to a classroom within five minutes of when a problem is reported. But, we have not always been good about tracking the exact number of problems to certain spaces or from certain people. Therefore, one of our goals become to track each call, record the room and the client. At first, that was only our goal — to track the information. Again, this went up on the dashboard and was discussed and shared.
Goals are only as good as the motivation of the people who are trying to hit them. One of my staff members suggested “gamifying” the dashboard — that is, to make a game of it. So, we bought a spinning wheel and listed a bunch of rewards on it. These include: donuts and coffee, lunch, happy hour, etc. If after a full month we hit those goals, we get to spin the wheel and the entire team reaps the rewards.
We do all of this internally, but these tools could be used just as easily with a service provider who is providing a managed service. We have a few managed services at our institution and none of them (surprisingly) provide such a service. If your contract says that you will respond to something within XX hours, why not use a dashboard to “brag” to your clients that you are hitting that goal XX% of the time? Another area that we are now moving into is the preventative maintenance aspect of collecting data. Why are we consistently getting calls to the same room? Is it the client in the room, or is there some other problem? A service provider can show the client how they do not let this happen. The dashboard could show how no space gets more than three calls per semester. If they get to two calls, a technician is sent out to do a thorough check of the room. They also can provide training to a client if that seems to be the problem.
Providing easy-to-read and easy-to-use dashboards should be a minimum expectation of any service provider. It helps solidify expectations between client and the firm. It also helps the firm then show the clients if they are meeting those expectations. In most cases, we would hope the firm is exceeding those expectations, not just meeting them. It also gives both the client and the firm the opportunity to see if their goals need to change. In a competitive environment like we have in the AV industry, you need to be able to demonstrate the value of your services. A dashboard is a logical way to do this.


More Stories Like This
Why Are We Doing This? Client Retention and Q4

One of my most annoying traits as a child has come in handy as a grown-up: asking obvious questions. My oppositional defiance disorder notwithstanding, asking obvious questions is useful precisely because they’re so obvious that sometimes no one has asked them before. That comes in really handy when evaluating things, especially policies and processes. Like […]
Customer Service Needs to Be a Top Priority

Companies often focus on things that are unique to them, or that they do very well. A company may have new, cutting-edge technology that makes them stand out, or it may have amazing logistics that allow them to have lower prices. The one thing that every company needs to have, regardless of its strategy and […]
Understanding First-Order Versus Second and Third-Order Metrics

Long ago, one of my old bosses and mentors had a favorite saying: “What gets measured, gets managed.” And he was right, as far as it goes. If you’ve got a metric and a system that reports on it, you pay attention to how you’re performing against that metric, and you make adjustments based on […]