
It’s 2017 and Video Content Is Missing
 Video sharing and advertising are ironically lacking from the audio, video and lighting (AVL) industry while the growth of this format and medium continues to become the defacto standard for consumption. The stats are in and they’re staggering.
Sometimes the writing is on the wall so clearly that you have to look at another wall to avoid it.
It’s 2017, and video content is missing from the industry with video in its name. There’s just no excuse for any firm today to ignore the power and reach of video as a medium.
YouTube By The Numbers
Staggering growth and unprecedented video consumption have been the hallmarks of the universal video platform of choice. It’s hard to believe that YouTube’s URL was only registred back in 2005, with Google buying the young start-up in 2006. Today, scarcely a bit over a decade in existence, YouTube boasts the kind of exponential growth that is hard to comprehend. To help paint the picture clearly for rAVe readers about both the remarkable growth and massive opportunity, I’ve included some of the 2016 YouTube stats that directly correlate to video content for promoting products and services in the AVL industry.
- YouTube is the world’s second largest search engine and third most visited site after Google and Facebook
- 300 hours of video are uploaded to YouTube every minute
- There are 3.25 billion hours of video watched each month
- More than half of YouTube views come from mobile devices
- The average mobile viewing session lasts more than 40 minutes
- The number of channels earning six figures each year on YouTube has increased by 50 percent year on year
- In December 2015, the most popular branded channel was Red Bull, which had 4.38 million subscribers
Advertising on YouTube continues to be highly effective… in spite of how often we cringe at being forced to view an ad.
- Viewers who complete TrueView ads — watched to completion or at least 30 seconds — were 23 times more likely to visit or subscribe to a brand channel, watch more by that brand, or share the brand video
- Viewers who are exposed to TrueView ads but who don’t watch to completion are still 10x more likely to take one of those actions.
- When brands use TrueView, they see views of previously existing content increase by up to 500 percent after posting new videos
Managing a YouTube channel professionally is a key part of leveraging the medium. The top brands that use,YouTube well do so with obvious intentionality:
- The most viewed brand videos are on average 31-60 seconds long (32 percent of all views)
- Interbrand’s Top 100 Brands are collectively uploading a video to YouTube every 18.5 minutes
- The same brands have an average of 2.4 channels
- Searches of “how to” videos on YouTube are growing 70 percent year on year

Source: https://www.thinkwithgoogle.com/infographics/video-trends-where-audience-watching.html
There cannot be a more prescient need to leverage video effectively, and the stats above provide ample marketing ammunition for manufacturers and systems integrators alike to take aim at creating video content. In fact, YouTube has made this process ridiculously simple to do with their free mobile app, YouTube Director. To demonstrate just how easy it is, I made a very quick (less than 10 minutes of total time) video specifically for this article. Take a look.
I used a video clip from ETC, one of my favorite AVL manufacturers due to their tremendous reputation and their consistent focus on the House of Worship market. Frankly, ETC is one of the few stand-out firms doing a fantastic job of leveraging video on their website, on YouTube and on Facebook Video.
Facebook Video by the Numbers
Facebook is easily the world’s largest and most popular social network, and their latest roll out of Facebook Video has been incredibly effective. Quoting MediaKix.com, “Globally, traffic from online videos will constitute over 80 percent of all consumer internet traffic by 2020 (Cisco), and eMarketer estimates that U.S. spending on both mobile and desktop video advertising will reach nearly $10 billion in 2016, more than a 23 percent increase than last year. By 2019, the total U.S. digital video advertising spend is projected to eclipse $14 billion — nearly 50 percent of that figure ($6.86 billion) is attributed to mobile video.“
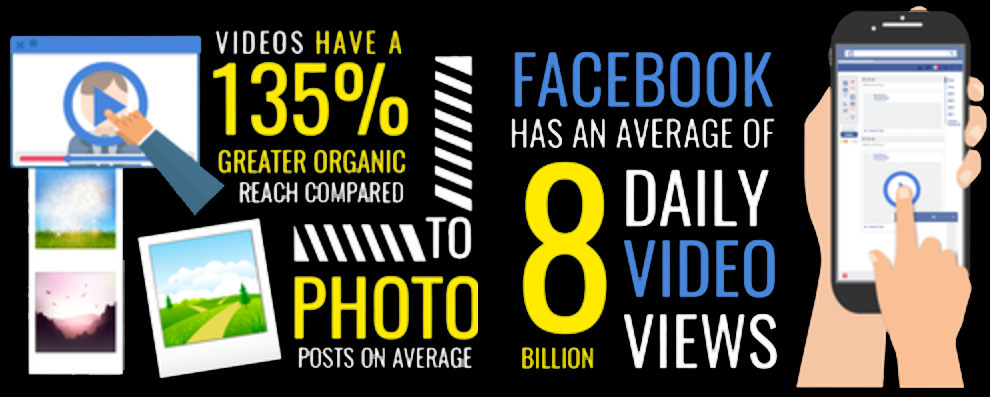
- Facebook generates 8 billion video views on average, per day = 100 percent growth in 6 months (Apr ‘15 – Nov ‘15)
- People spend 3x longer watching video which is Live compared to video which is no longer Live
- Facebook users increased the number of videos posted per person by 75 percent globally in 2015. In the United States, this growth was even more impressive rising by 94 percent
- Video posts have 135 percent greater organic reach than photo posts
- Surprisingly, given the limited exposure of Virtual Reality content, Facebook users have watched more than one million hours with Samsung VR gear
- Total potential Facebook video viewing audience: 1.71 Billion Monthly Active Users
- 84 percent of Facebook ad revenue is from mobile
One of the stats that’s not yet represented is the use of 360-degree photos and videos, which was rolled out on Facebook in 2016. If, after seeing all of these stats, your firm doesn’t begin to embrace Facebook as a viable channel to connect with passionate users and prospects, I don’t know what will. These stats are amazing and should not be ignored if your firm wants to take full advantage of this nothing-but-growth medium.
Source: http://boldcontentvideo.deviantart.com/art/Facebook-Video-Statistics-For-2016-Infographic-621573896
It’s 2017. We are the audio, video and lighting industry, right? Let’s walk the talk and begin using video content as both a key product and services showcase as well as an engagement channel for connecting with and giving voice to passionate AVL fans.
How is your organization using video as both content and a channel for engaging with users and prospects? Share your views and opinions in the comments below.
*Sources. I used a lot of sources to pull these stats together:
- brandwatch.com/blog/36-youtube-stats-2016
- thinkwithgoogle.com/infographics/video-trends-where-audience-watching.html
- http://mediakix.com/2016/08/facebook-video-statistics-everyone-needs-know/#gs.rfSqjLc
- socialmediatoday.com/marketing/top-5-facebook-video-statistics-2016-infographic
- boldcontentvideo.deviantart.com/art/Facebook-Video-Statistics-For-2016-Infographic-621573896
- director.youtube.com/directr


More Stories Like This
New Study Confirms What AV Pros Already Know: Audio Quality Matters

In an NPR article posted Monday (and in an “All Things Considered” segment), Nell Greenfieldboyce urges users of Zoom, Microsoft Teams, Webex, etc., to pay attention to how their computers are altering their voices. She points to a new study published in the Proceedings of the National Academy of Sciences that found high-quality audio makes […]
rAVe’s Audio Symposium — Here’s What You Missed!

rAVe’s Audio Symposium, powered by LAVNCH, brought together audio experts to discuss trends, challenges, and best practices in AV. Spanning five 30-minute panels, the event offered insights on everything from hybrid workspaces to immersive exhibitions. Here’s a recap of the discussions, but make sure to watch the event on demand here for all the details. […]
November 2024 Temperature Check Survey — Now CLOSED

The November 2024 Temperature Check survey is now closed. Keep an eye out for next month’s survey! Audio is of utmost importance in nearly all aspects of the AV industry. We talk a lot about how you can have a meeting with no video, but if you attempt to have one with no audio, you’re […]