The Sensor/Data/Analytics Footprint
 This is part four in a four-part series Christopher Gillespie has been writing about the relationship between end users and integrators, particularly with regards to corporations or educational institutions that have a large number of conference rooms. See part one, his introduction, here, part two on the AV bill of materials here and part three, on ITSM architecture here.
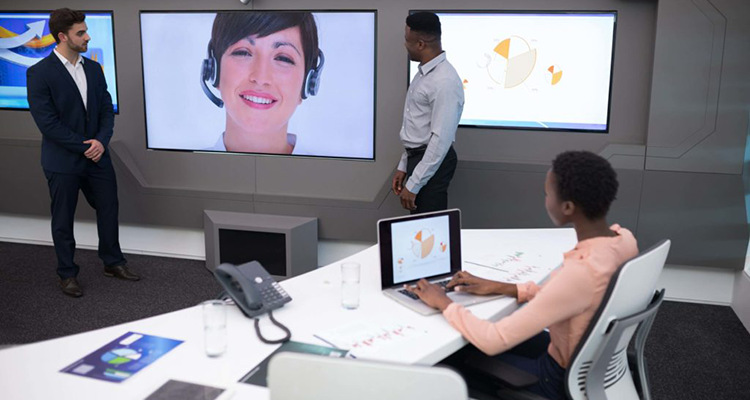
Ten years ago, setting up small conference rooms was kind of easy — put in a TV/projector and maybe a small sound system and you are done.
Not so much anymore. We are in a brave new world of IoT data and context. It is not just enough to have a bunch of functioning rooms. We need to know:
- How are these rooms used? Can we track temperature, occupancy, no-shows?
- What’s going on in those spaces? Did the users actually use the technology or not? Were the whiteboards cleaned? Is the clock set to the right time?
- How can we head off issues before they happen, or at least see them AS they are happening? Can we remotely detect problems or detect confused users? Can we know when a laptop was left behind?
These are three quite different questions and just five years ago, the thought of asking these questions would have been almost absurd. However, times have changed. Now more and more, devices are no longer just being created that show the image, or take a picture… they are making greater and greater use of sensors tied with artificial intelligence, machine learning and deep learning all the time to give us far more info than we ever imagined.
[A clarification: Artificial intelligence (AI) is a term we see thrown around all over the place. And by and large… it’s inaccurate. What we are seeing an explosion of is machine learning (ML) and deep learning (DL). AI is a future state system that is able to seemingly perform human functions. We are not there in our world. But the ML and DL tools which are the building blocks of those systems are absolutely in use. They are the tools of the dark wizards called data scientists. And they all are a part of this emerging world. For a bit deeper explanation, please read through this page.]
Although, let’s be honest, the solutions we want or need, and those that are shipping today, are not always… aligned. But that doesn’t mean that we shouldn’t be planning for that future state. To answer all these magical questions and provide these answers, we need to start really thinking about what things we want to know. And while every organization will be a little different, there are some really solid commonalities. The basic foundational questions start off here:
- What percentage of business hours are rooms booked?
- What is the overall percentage of room usage?
- In each of the rooms, how many people are in the actual room (face counting can be very different than facial recognition?
- How many people “saw” a given display (digital signage metrics)?
These are questions that tell us where we need to invest and how we need to potentially change the ratios of room sizes in future builds. This data is the gateway drug when it comes to developing a data addiction. If we can capture all of the above and then present it in a clear meaningful fashion in a real-time dashboard, then we can assist the business to make better decisions.
Most of the above can be easily captured today. Whether it’s the Polycom Producer or the Cisco Room Kits, they can tell us those numbers of people. But that’s only half of the equation. One of the great little known weaknesses of our software landscape is the complete lack of reporting capabilities of Microsoft Exchange. It just wasn’t built to provide easy exporting of lots of data to build reporting. Anytime I have gotten into trying to pull room analytics, we had to do a manual Excel dump of each room and then start filtering and pivot tabling the heck out of it. And once we do all that, we have a static report. The good news is that there are companies that are backfilling that gap. And if you start diving into conference room reporting/analytics, you’ll find that it is a rapidly growing field.
My a-ha moment came when going through an exercise in resource planning. We were asking the question, “Do we have enough staff to support the business?” This seems a simple enough question but as soon as you say ‘yes!’ or worse, ‘no!’ to your CIO, they will respond (usually with a dour look and folded arms), “Prove it!” or alternately, “Show me the data!” And you go to speak, but no words come out. And then you will sink into a pit of confusion. OK, well, maybe that was just me. But it started a critical conversation about data.
One example of something we ended wondered about and ultimately answered was, “How many concurrent meeting starts do we have each day?” That led to, “How many days a week/times a day do we have more than XXX meetings starting at the same time?” This seemed like a good idea, but where to find that info? Pulling down Excel files for each room on campus and then correlating it all together seemed like an insurmountable task. And that wouldn’t actually tell us if technology was being used. But we realized that, as a BlueJeans shop, we were already dumping all the data from BlueJeans’ Command Center into Splunk, and we should just be able to put in a filter or two in order to start looking at concurrent call starts. We filtered to look first at meeting rooms and then campus/buildings, etc. — from this, we got a number that was actually kind of scary, but it made the case to add more resources. It also allowed us to set triggers for when we would add another person. It was actually a really powerful number that showed us how much was really going on, which was far more than we realized.
What was great about this was that once we saw the data that we could get, we just started grabbing it. We didn’t know how we would use it, we just knew that we would eventually. Those insights allowed us to make better decisions for the business.
Where things start to get really interesting is once we move past the basics like I just mentioned. More and more devices are showing up that have additional sensors that allow the device to feed out more info about the space and usage via the API.
I wrote a piece a while back that I called “Don’t Bring Me Gadgets… Bring Me Data!” in which I talked about the fact that a new gadget that is just an improved version of the OLD gadget is a gadget I’m not in the least bit interested in. But a new gadget that does what the old gadget does but also does new things and gives me data… now I want to see that gadget.
So we started looking at sensor-enabled device thingamajigs and found ourselves really excited by one in particular, Windows Collaboration Displays (WCDs). Based on the work that Microsoft has done with the Surface Hub, and other research, they have realized that we need not just a display with established interoperability throughout Windows, but also some basic info about the room. And the WCD is the first push into that arena.
With a WCD, you get a monitor with all the various features one would expect. But what makes it stand out is the fact that there is also a sensor package integrated into the display that reports occupancy (just a yes/no — no people count), temperature and light levels. It does this with a standardized API that Microsoft has created that allows you to send data to Azure, tie it to your Outlook 365 Exchange instance and develop a real-time dashboard showing occupancy, temperature and light. Why might we want this info? How about automating blinds, or adding more cooling to a room that it turns out was immensely unpopular due to it being way too hot in the afternoons?
Sensors ➙ Data ➙ Insights ➙ Inform actions ➙ Improved Outcomes
If we start looking at the more cutting-edge products and stuff that is coming, things are clearly moving towards Star Trek stuff. The folks at Jabra Panacast go many steps further with the newest camera that along with all the super cool 180-degree viewing field, low light performance, whiteboard viewing/correcting video, etc., the company’s AI stack and the data that flows out via the API is absolutely insane. I am not sure what is and isn’t public knowledge so I will refrain from mentioning more, but to me, that camera is 10x more valuable as just a sensor/data package in a room than the video part. I would gladly put them in rooms just for the data alone.
The reality is that we could do an all-day class at InfoComm based on 10 sensor-equipped devices and their APIs and not even come close to defining all the things we could do with that data. This is the future of what we need.
Maybe not this InfoComm, maybe not ISE in a few months… but one day soon, the pundits in the industry will declare that year/show/whatever to be the dawn of the age of data/context in the AV world. There are so many things that can be done that will allow us to make better use of resources. I mentioned a while back that we need to work with integrators to get installs done faster with less resources. That also holds true to those of us in the end-user world. We need to provide better support to more rooms with a more complex technology stack with less resources every year. Sensors and data are the ticket to that.
Now the sensors are just a part of this overall equation. The sensor is just a box that connects to the network and has an API that feeds all that data out. So we need to be looking at vendors or, alternatively, developing our own capabilities internally to build out the applications and dashboards that make use of this data and present it in a useful fashion. We need to find partners that are masters of the API in order to ensure that we can both build a reporting platform today, and also integrate it with all the other tools in our stack:
- Poly RM
- Cisco TMS
- Utelogy
- Barco Overture
- Crestron Xio Cloud
- Extron GlobalViewer
- Harman RMS
And most importantly…
It is critical that when we look at these platforms, we understand that the various sensors, etc. will not only be coming from the AV world. We need to receive network data, alerts from all manner of things. They will come from a wide variety of vendors and have extremely broad capabilities. Gone are the days when we just need the AV control/management platform to turn the TV on and off. We need to integrate disparate platforms together with all manner of custom code and custom applications. What this means is that we need to dive deep into how our AV management platform is able to take all this data and work with it. Will it exist in its own silo, or is it broad enough that as we develop our own tools, will we be able to integrate them into the same piece of glass?
At a company I previously worked for, we had issues with the provisioning of codecs from one vendor. The tools they developed didn’t ensure that all options could be set as desired and we needed lots of different permissions and so forth. And as we had about 600 codecs deployed, it seemed that at least a few times a week we were either installing a new one or replacing one to RMA. As a response to this, the UC engineering team just built a provisioning tool using available APIs that anybody on the team could use. This tool allowed us to have a codec be 100% provisioned, and it also talked to the DHCP system and made a reservation for the device.
I only bring this up as this tool (and others we had built) would exist in its own silo in many of the solutions listed above. However, some of them are really more of a platform and those tools could be integrated right into them. Down the road, this can offer quite a bit of advantage as we look at sensor deployments and the like, so it’s always important to make sure that your tools are as open as possible.
Conference rooms are one of the costliest resources in the corporate world. And yet we know very little about how they are used. It’s not enough to know if they are booked or not. Just like space planning teams go around figuring out how many people are actually sitting at their desks as they plan for future growth… we need to know if the rooms are being used? Are they booked but users no-show? Are three people in a 20-person room? No videoconferences happening in a videoconference-equipped room? We could go on and on. Knowing how and where things are being used affects our ability to build spaces with the right breakdown of small, medium and Large conference rooms. Huddle spaces, touchdowns, phone booths, the right technology package… it’s all part of the best experience for everyone involved. The modern corporate campus is in a period of rapid evolution. If we want to ensure that it’s on the leading edge, we need to ensure that we have solid data to help make the right decisions.
If we are going to get info on how the space is used and how often, what the occupancy rates are, etc., we need to have tools in place to capture that data and then have a mechanism on the backend to correlate and present that info in a CLEAR, relevant and meaningful fashion. Only from that can we take actions and make things better.
In summary… I will say it again:
Sensors ➙ Data ➙ Insights ➙ Inform actions ➙ Improved Outcomes
And in the end, that is what we all want.
These last few articles have touched on quite a bit of information, lots of things about which you may have questions. Please reach out should you have any feedback. And also, if there are any topics you would like to see discussed, please let me know.
More Stories Like This
3 Tips for Using Projection in Visualization Environments

I haven’t written a technical piece in a while, but I’ve been moderating AVIXA ‘s Control Room Power Hour series of webinars, and a subject that has come up a lot is the use of projection in data visualization environments. Projectors are still viable in these types of rooms. With the advent of laser projection, […]
A Secret Productivity Killer Called “Double Join” Haunts Most of Our Meetings – And We Deserve Better
I’d never heard the term “double join” until a few months ago on a call with one of our board members, John Case, who is a great resource to talk with if you’re researching the world of video conferencing. John spent a long time at Microsoft building the Office 365 product family and now puts […]
Part 2: How the 5 Books of ITIL Can Relate to AV
In the last article, I gave an overview of what ITIL/ITSM are and how a similar methodology could be beneficial in the AV world. In this follow-up, I want to discuss the five volumes or books of ITIL and how they can translate to AV. A repeat of the disclaimer: I am in no way […]