Positive Trend in the CE Industry
By Norbert Hildebrand
Two weeks ago I discussed the results of Samsung’s and Apple’s third quarter results. This week I want to discuss the results of the not so fortunate companies in the CE Industry.
As we all have heard, Sharp is in bad shape with several companies including Intel and Apple rumored to be potential new investors in the company. While the Apple investment together with the earlier Foxconn investment plans are driven by their interest in display technology, the Intel interest is revolves around other parts of Sharp or is a pure financial investment. Either way, the stock price of Sharp reacted very positively to these rumors. Hopefully, a cash injection together with more display sales to Apple will help to turn the ship around. Sharp is missing from the following chart as they are not releasing quarterly data (there are only half yearly results posted).
Let us take a look at the results of the rest of the major players. The selected companies are chosen as major players in CE device sales, and historical reasons, are kept constant for better comparison.
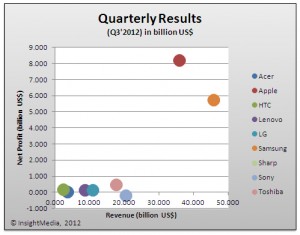
First, the profitability versus revenue shows very little change compared to the previous quarters. The CE Industry remains a two class society with Samsung and Apple as they ‘haves’ and the rest as the ‘don’t haves.’
The good news here is that all companies besides Sharp, Sony and Panasonic, produced a net profit. But Sony and Panasonic are only slightly negative and much improved over the same quarter last year.
As it looks right now, profitability requires substantial revenue in the CE industry. I know that there are plenty of smaller companies out there that are profitable and even some larger companies like Microsoft, Intel and Qualcomm are very profitable. However these companies are creating these profits from components and software not from device sales (the companies chosen for this comparison).
To get a better feeling of where the industry is heading, I compare the trends within each company in the attached bubble chart. You see the net-profit growth plotted against the sales growth vs. the same quarter of 2011 to eliminate quarterly fluctuations. The size of each bubble is determined by the absolute revenue in the third quarter of 2012.
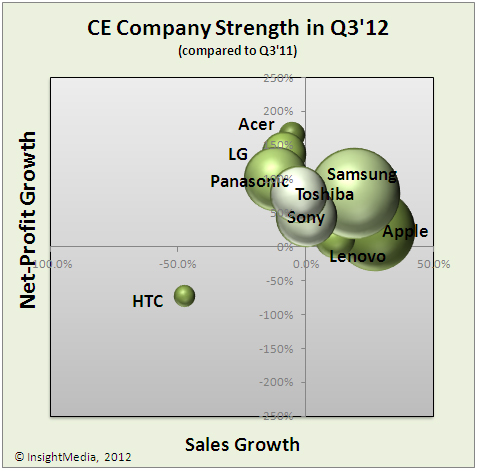
To interpret this chart correctly keep in mind that 0 percent growth on either axes represent the same result as last year. If the company had a loss in last year’s quarter, 0 percent means they still have the same loss this year. Progress means you want to be in the top right quadrant. As we can see, all companies besides HTC are in the upper half of the chart, meaning their profitability has improved in the last quarter. Beside Apple and Samsung, Lenovo also manged to improve not only profitability but also sales.
So, why do I believe this is a positive trend for the whole CE industry? Compare this chart to the same graph for the second quarter of 2012. For your convenience I have the old chart attached below.
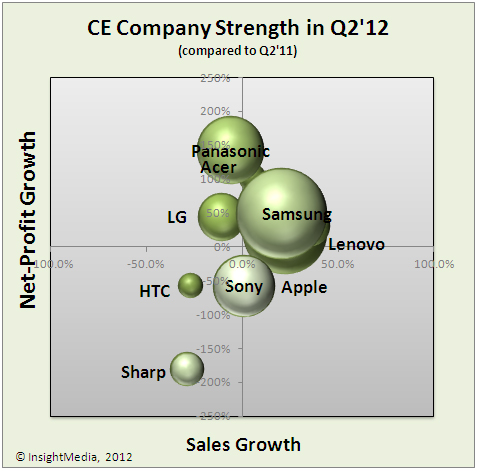
As we discussed the goal is to move to the upper right quadrant. You can see that most companies made good progress towards this goal.
By no means are we in a very positive business environment, but the overall trend is positive and if this trend continues, we will see more positive results in 2013.
Of course there is a threatening economic outlook with the European and US debt crisis combined with some economies slowing down. There may be more rough water ahead of us, nevertheless, the third quarter had a very positive trend that will hopefully continue for the next quarters. The industry needs some recovery after several quarters of suffering.

More Stories Like This
NVIDIA Shows a High Resolution Display Solution Based on Cascaded Display Panels

By Norbert Hildebrand Display Central High resolution displays in mobile applications are a definite trend among new devices, even though this trend may be more driven by marketing thinking than actual necessity. Most people will not be able to see a difference between a 5″ HD (294ppi) and full HD (440ppi) display, but it makes […]
My InfoComm 2014 Impressions
By Norbert Hildebrand Display Central Here we are. InfoComm 2014 is basically over and all the polished product presentations are being broken down and shipped back to the office. The main event for the Pro AV industry is closing their doors on Friday and the excitement of the last three days gives way to ‘business […]
2014 – Let the Worldwide 4K Games Begin
By Norbert Hildebrand DisplayDaily During last year (Yes, it is already 2014!), high resolution (4K or UHD) TVs have become available in the market and prices have dropped faster than anyone expected. As a result, the sales volume has risen quite nicely and is running ahead of earlier expectations. Of course it is not clear […]