Fill Factor – the Next War in Display Technology
 By James Fife
Consultant Extension, rp Visual Solutions
When it comes to display properties that affect performance, one of the most misunderstood is visual acuity. Acuity in a display can be related to the hardware, content and overall image size. This article is in relation to the hardware and how it relates to human eyesight. Determining a display’s acuity allows a designer to determine if the system has acceptable detail at the nearest usable viewer and the ideal viewer distances, while being display-technology agnostic.
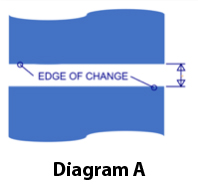
Visual acuity, regarding eyesight, is the ability to see fine detail in a high-contrast, stationary setting. With any movement, the human eye can discern a dot that is 1’ (’ = arc minute or 1/60th of a degree) when it is black on white. This is a well-known value, but what is imperative to take note of is what is being measured: It isn’t the distance between two-line centers but, rather, the distance between the edges of the change of state. Refer to Diagram A, which points out the edges where it changes from dark to light to dark. The amount of blue top and bottom is not relevant to acuity measurements. It is the distance in the middle that is critical, because it can be vastly different when comparing differing technology types, even while pixel density remains the same.
 Before we dive into displays, a short dive into the math to calculate the acuity height of human vision is required. In order to calculate acuity for human vision, any two of three values must be known: (a) acuity height of target item, (b) distance to target item and (c) the angle the human eye can see. It is worth repeating that the angle the human eye can see is a constant that is known to be 1’. The formula for solving distance to a viewer is as follows: Distance (D) = acuity height (H) / tan (1’). This formula holds true, and only values for either D or H are required to solve the equation. To make this easier, the formula can be reduced by solving the tangent, creating H = D / 3438, or D = 3438H (both rounded to nearest single digit). This is a fairly well-known equation, but, historically, it has been applied incorrectly to pixel density, and this is where things get interesting.
With regard to acuity and the image on a display, the smallest detail any display can create is one dot. That is done by turning a single pixel off. This is also the smallest artifact size that can be created by a display, creating a darkened spot in the image. This distance also adds up to create jagged edges on curved lines or bright/dark lines, due to incorrect spacing of pixels or panels. In order not to see any artifacts in an image, the viewer must be far enough away so that his or her distance makes the detail uniquely unperceivable. That distance can be found using the Ideal Acuity Height (I). In a display, this is the distance between two pixels with the center one off.
 Refer to Diagram B, showing Ideal Acuity Height to be from the inside edge of the pixel that is on to the inside edge of the next pixel that is on, with a pixel off in the middle. If you are closer to the display than this distance, the image will still appear to be pixel-based and it won’t look as smooth as an analog solid line (like a painting or a drawing). To calculate the Ideal Acuity Height, take the equation for acuity for human vision and substitute variable H with I, giving the equation D=3438I. Beyond that distance, there will be no perceivable pixels or artifacts, regardless of content. Also, take note that, beyond that distance, any more resolution is of no benefit to a viewer.
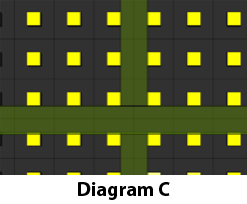
The other distance that is often required in a display system design is the minimum viewing distance. Although this is somewhat subjective, the definitive closest viewer is where artifacts are visible, but the pixels start to convolve into an image. Put another way, it is where the screen door effect starts to go away. There are several rules of thumb for this, but none of them is technology-agnostic, and none takes into account pixel fill factor. To solve for this, it is required first to look at what allows the image to start to merge. The screen door effect is caused by the eye seeing the lines rather than the image that is being created. In a pixel-based image, there are lines that are solid across or up/down the image between the active areas, as seen in Diagram C. Once a person moves beyond the thickness found using N for Acuity (refer to Diagram B), they start to see the image, not just individual dots. To calculate the nearest acceptable viewing distance, use the formula D=3438N by exchanging height H with N in the acuity formula.
 Returning to human optics, what is interesting to note is that the human eye is able to see a line 60 times more easily than a dot, as long as the line extends beyond 30’ in angular width. This means that, for any pixel-based image, alignment between the rows of pixels is critical. A variance in alignment vertically, horizontally or front to back between panels affects N for a single line space, and differences become painfully apparent. Narrow-pixel-pitch, direct-view LED is the one technology that demands very high-accuracy mounting and integration. It is imperative that the pixel spacing be very consistent across the entire image to give the illusion of a single image, rather than a set of separate tiles.
At this point, it has been shown what the nearest and ideal distances are, and why. The issue is that most manufacturers do not state what these dimensions are for fixed arrays. Additionally, for some technologies, the distances are not always the same, because they change based on zoom capabilities. However, they can be solved for by using the dimensions of the pixel itself, or pixel density and fill factor. The parts of a pixel are shown in Diagram D, which shows the pixel height, the blank area and the active height. The easiest way to solve for the pixel-size values is to use the variables, pixel height and the fill factor. For variable-size technologies, like projection, the pixel height is the display height or width divided by the number of pixels.
Fill factor is the next thing for which to solve. Fill factor is the relationship between the area of the entire pixel and the active portion of the pixel. Fill factor (F) is expressed as F = A2 / P2, where F is fill factor, A is active size within a single pixel and P is the total pixel size. This equation can be rearranged as shown in Diagram E. The key is that fill factor is a relation of area, and not distance. So, a value of 0.25 is a 25-percent-full pixel, which means four active areas of that size would be required to fill the pixel.
 Luckily, fill factor is stated by some manufacturers of projectors and LED products, and it can also be measured physically. For general use, in Table A, there is a list of generic fill factors, along with calculations for a 1.2-millimeter pixel density. As can be seen below, the larger the fill factor, the closer both the nearest and ideal viewing distances can be. Fill factor is certain to become a heated battle in display technologies, as many have reached a point where more density is nearly impossible, or simply cost prohibitive. It cannot be stressed enough how important fill factor is to overall image quality.
 It is possible, using fill factor and pixel density, to solve for all the other pixel values—specifically, the active height. The distances that are of interest are Ideal Viewer Distance (I) and Nearest Viewer Distance (N). In reference to Diagram B, I is nearly two full pixels tall in the diagram. It is shy of two pixels by the height of one active (A) height. That means that 2P (pixels) minus 1A (active area) gets you distance I. This is expressed I = 2P – A. Looking at N, it is very similar. For distance N, it is nearly one pixel, but short by the active area, as well. So, N is 1P (pixel) minus active height shown as N = 1P – A. This now offers the height to use for distances ideal and nearest viewing.
Finally, the last stage is to combine the formulas to create the master nearest and farthest equations. For nearest viewer, this was done by removing N from D = 3438N and substituting that with P – A, yielding:
![]()
Then, remove the A and replace it with:
![]()
as seen in Diagram E. That gives the final equation of:
![]()
The same exchanges can be done with the Ideal Viewer to get the final equation pair as follows:
Ideal viewer distance:
![]()
Nearest Viewer distance:
![]()
In conclusion, a great-looking display requires many factors to be considered, all of which are interrelated. Fill factor plays a very critical role in overall image quality. Small changes in fill factor can dramatically change the I and N values. By designing around these values, a designer can save a client a lot of money by ensuring the right technology is chosen for a given environment. Most important, however, is that the nearest and ideal viewer positions can be solved for using math related to human visual acuity. These are real values, removing the marketing aspect. Have fun designing and running the numbers, and ensure you get that alignment right. The appearance of the final image depends on it.
Reprinted with permission from James Fife and rp Visual Solutions

More Stories Like This
Rp Visual Solutions’ New Wallmate Mounting System Can Hold Up to 400 Pounds

Rp Visual Solutions (rpv) announced it will be launching a new Wallmate mounting system that greatly simplifies the installation of increasingly popular, seamless LED video walls. It includes: All-in-One LED video wall-style displays that have “much larger backer frames compared to LCD and OLED flat panels.” A 400-pound display weight capacity. Strategically positioned strengthening of […]
rp Visual Solutions Expands Wallmate Line With Wallmate Surface On-wall Panel Installer
Rp Visual Solutions expanded the Wallmate line to include the new Wallmate Surface. The Surface is a steel on-wall system designed for single display panel installations. The Wallmate Surface is designed for the clean installation of displays. Peripherals such as video receivers, signage players or UC interfaces can be mounted to plates inside the back […]
rp Visual Solutions Introduces Wallmate T-Up Panel Display Mount
rp Visual Solutions added the Wallmate T-Up to its line of panel display mounts. The T-Up is designed to simplify on-wall mounting of 75- to 100-inch heavyweight panel displays. The T-Up system is part of the company’s plan to create products for the installation of displays and additional peripherals such as video receivers, signage players or UC […]